Dying Oceans
What damages are we seeing in marine ecosystems? What are the causes, and future projections? A summary from my climate research notes.

We’re observing damage to marine ecosystems
Habitat destruction
Coastal wetlands
Vegetated coastal ecosystems protect the coastline from storms and erosion and help buffer the impacts of sea level rise. Nearly 50% of coastal wetlands have been lost over the last 100 years, as a result of the combined effects of localised human pressures, sea level rise, warming and extreme climate events (high confidence). 2
Decrease in maximum catch potential
Ocean warming in the 20th century and beyond has contributed to an overall decrease in maximum catch potential (medium confidence), compounding the impacts from overfishing for some fish stocks (high confidence). In many regions, declines in the abundance of fish and shellfish stocks due to direct and indirect effects of global warming and biogeochemical changes have already contributed to reduced fisheries catches (high confidence). In some areas, changing ocean conditions have contributed to the expansion of suitable habitat and/or increases in the abundance of some species (high confidence). These changes have been accompanied by changes in species composition of fisheries catches since the 1970s in many ecosystems (medium confidence). 3
Poleward migration
Species are moving towards the poles as waters warm, chasing food sources and the temperatures they are accustomed to. The geographical range and seasonal activities of species has moved, by average 52 km / decade since the 1950’s (for species in the upper 200 m from sea surface). Rates are shaped by local temperature, oxygen, and ocean currents. 4
Increase in Arctic net primary productivity
In recent decades, Arctic net primary production has increased in ice-free waters (high confidence) and spring phytoplankton blooms are occurring earlier in the year in response to sea ice change and nutrient availability. 5
Net primary productivity is “the rate at which energy is stored as biomass by plants or other primary producers and made available to the consumers in the ecosystem.” E.g. plants and algae producing organic material by photosynthesis. 6
Polar habitats shrinking for marine mammals and seabirds
In polar regions, ice associated marine mammals and seabirds have experienced habitat contraction linked to sea ice changes (high confidence) and impacts on foraging success due to climate impacts on prey distributions (medium confidence). 7
Climate and non-climate human activities are combining
In most cases, the damage we’re seeing is due to some combination of climate and non-climate human activity. For example, fisheries are damaged by both over fishing, and marine heat waves. And harmful algal blooms are fueled by both agricultural pollution, and warming oceans.
Warming oceans are triggering other drivers

Marine heat waves
“A period of extreme warm near-sea surface temperature that persists for days to months and can extend up to thousands of kilometres.” 11
Since 1982 they have doubled in frequency, while increasing in size, intensity, and duration. Per the 2019 IPCC Ocean and Cryosphere report:
“Marine heatwaves, periods of extremely high ocean temperatures, have negatively impacted marine organisms and ecosystems in all ocean basins over the last two decades, including critical foundation species such as corals, seagrasses and kelps (very high confidence). Satellite observations reveal that marine heatwaves have very likely doubled in frequency between 1982 and 2016, and that they have also become longer-lasting, more intense and extensive. Between 2006 and 2015, 84% to 90% (very likely range) of all globally occurring marine heatwaves are attributable to the temperature increase since 1850-1900.” 12
Confidence is high that marine heatwaves are driven by human-induced global warming. 13
Marine heat waves negatively impact marine ecosystems in several ways: starvation, algal blooms, coral bleaching, and species migration. See dedicated sections for details.
Starvation
Warm waters are less nutrient rich than (typical) cold upwelling waters. This reduces phytoplankton (microscopic marine algae) productivity. Which reduces zooplankton populations. Which starves fish such as coho and Chinook salmon, and/or drives them to seek food in new areas. Which starves predator species higher in the food chain, such as sea lions and whales. 14
Warmer waters also shift less-nutritious zooplankton species northwards. “Squishy” gelatinous warm-water zooplankton end up in waters that normally contain “crunchy” shrimp-like cool-water varieties (e.g. krill). The squishy species are much less nutritious, so species that rely on zooplankton for food (e.g. salmon, birds) experienced diminished growth or starvation. 15
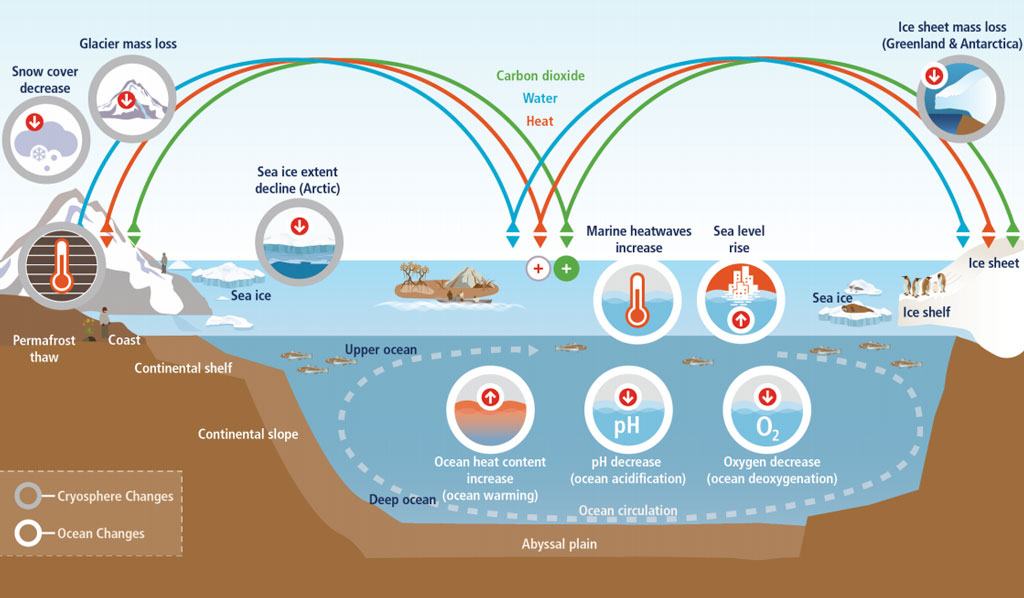
Acidification (pH decrease)
“The ongoing decrease in the pH of the Earth’s oceans, caused by the uptake of carbon dioxide (CO2) from the atmosphere.” “Dissolving CO2 in seawater increases the hydrogen ion concentration in the ocean, and thus decreases ocean pH…” 16
- Ocean pH levels are at their lowest in 20 million years. 17
- Ocean has absorbed 20-30% of of total anthropogenic CO2 emissions since the 1980’s. 18
- Acidity has increased 26% “…since the beginning of the industrial revolution.” 19
- Hurts marine ecosystems by: 1) potentially depressing metabolic rates and immune systems, 2) contributing to coral bleaching , and 3) preventing or decreasing the calcification of shells and skeletons (impacting oysters, clams, scallops, mussels, etc). 20 21
Stratification
Upper layers of the ocean become less dense than deeper layers, due to surface warming and freshwater runoff. This reduces churn between the layers, trapping nutrients that would otherwise be carried up from the depths.
Deoxygenation (oxygen decrease)

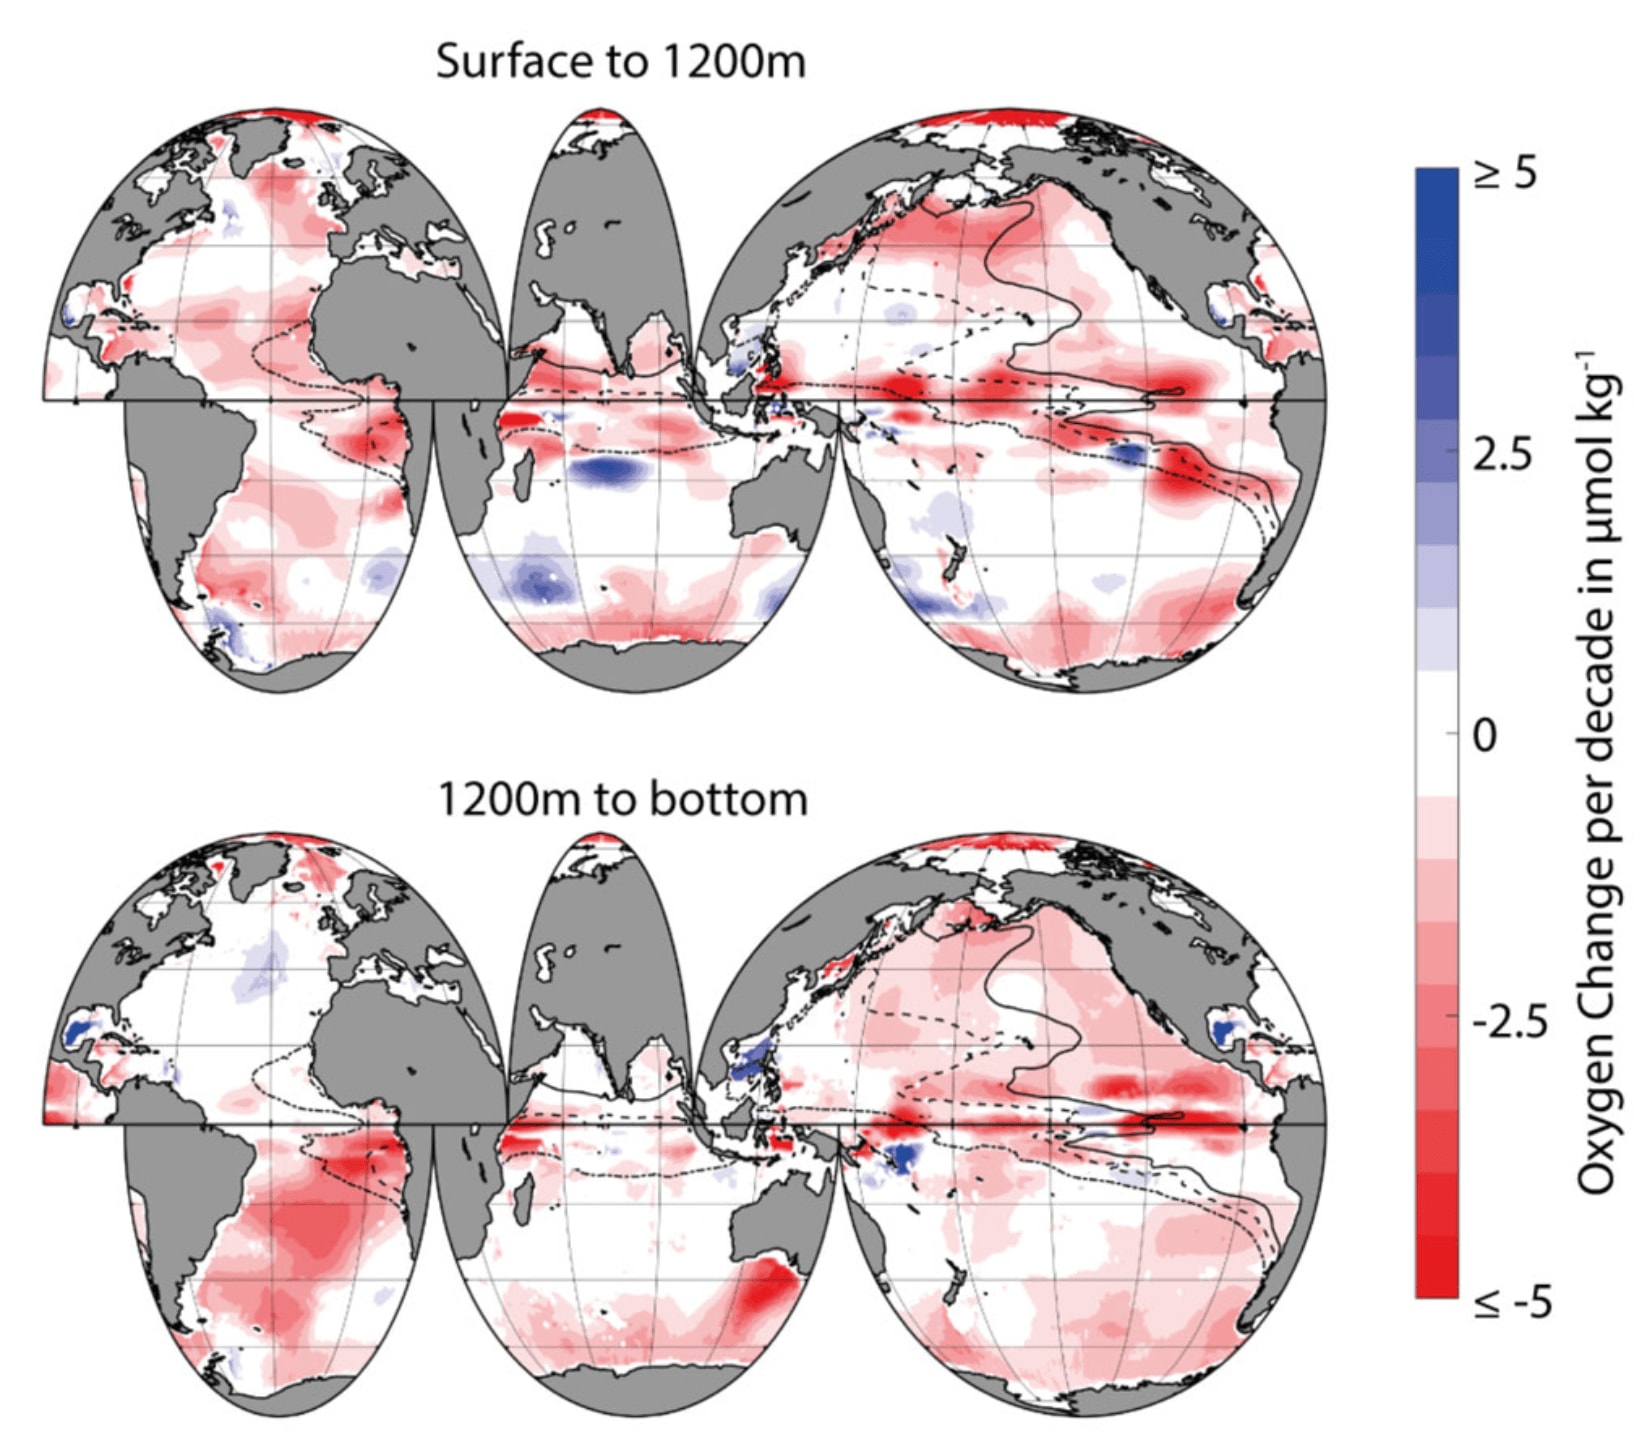
Oxygen is critical to all higher forms of marine life. Oxygen in the oceans is only around 0.6% of that in the atmosphere.
Levels vary regionally, but measurements show global decrease in ocean oxygen of 0.5-3.3% in the upper 1000 m, since 1970. This has been caused by: warming (warmer water cannot absorb as much gas), ocean stratification (reduced mixing between oxygen-rich surface and oxygen-poor depths), ventilation, and biogeochemistry. 23
Deoxygenation contributes to “oxygen minimum zones”, where oxygen levels are too low for marine life to live. These zones can also release nitrous oxide (N2O), a powerful greenhouse gas. The volume of oxygen minimum zones has likely increased by 3–8% since 1970. 24 25
Algal blooms
These are unusually high concentrations of algae, most commonly found in marine or freshwater. Algal blooms are naturally occurring, but are exacerbated by various human activities, including climate change. Agricultural pollution (e.g. manure and fertilizer) can lead to an over abundance of nutrients and “overfeeding”. And “…sluggish water circulation, unusually high water temperatures…” (as during marine heat waves) have also been found to coincide with blooms. 26 27
Per the IPCC Ocean and Cryosphere report:
Harmful algal blooms display range expansion and increased frequency in coastal areas since the 1980s in response to both climatic and non-climatic drivers such as increased riverine nutrients run-off (high confidence). The observed trends in harmful algal blooms are attributed partly to the effects of ocean warming, marine heatwaves, oxygen loss, eutrophication and pollution (high confidence). 28
Bloom colors can be “…green, yellowish-brown, or red. Bright green blooms may also occur. These are a result of blue-green algae, which are actually bacteria (cyanobacteria).” 29
Impacts
Harmful algal blooms are those that injure animals or the ecology 30, through the following mechanisms:
Dead zones: Algae produce oxygen during the day (photosynthesis), but absorb it at night (respiration). And as algae die, they provide food for bacteria, which in turn absorb oxygen both day and night. If the algal bloom is large enough, these processes can reduce oxygen levels below the threshold needed for marine animals to live. Leading to mass die offs of fish, etc. These areas are called dead zones, and can be thousands of square kilometers in size. 31 See also “Oxygen Loss” section above.
Toxins: 2% of algal blooms are toxic. Terrestrial species are harmed when the drink, swim in, or (in cases where toxins become airborne) come near the blooms. Marine species are harmed when they consume toxin-contaminated food sources lower in the food chain, (e.g. krill and sardines). During the 2015 “Blob” marine heat wave scientists attributed a toxic algal bloom to the deaths of 30 whales washed up on the coast of BC and Alaska, and to mass die offs of marine mammals in California. 32
Smothering: Algal material can “…clog the gills of fish and invertebrates, or smother corals and submerged aquatic vegetation.” 33
Projected future changes and risks
Physical changes
Per the IPCC’s “Ocean and Cryosphere in a Changing Climate” report: 34
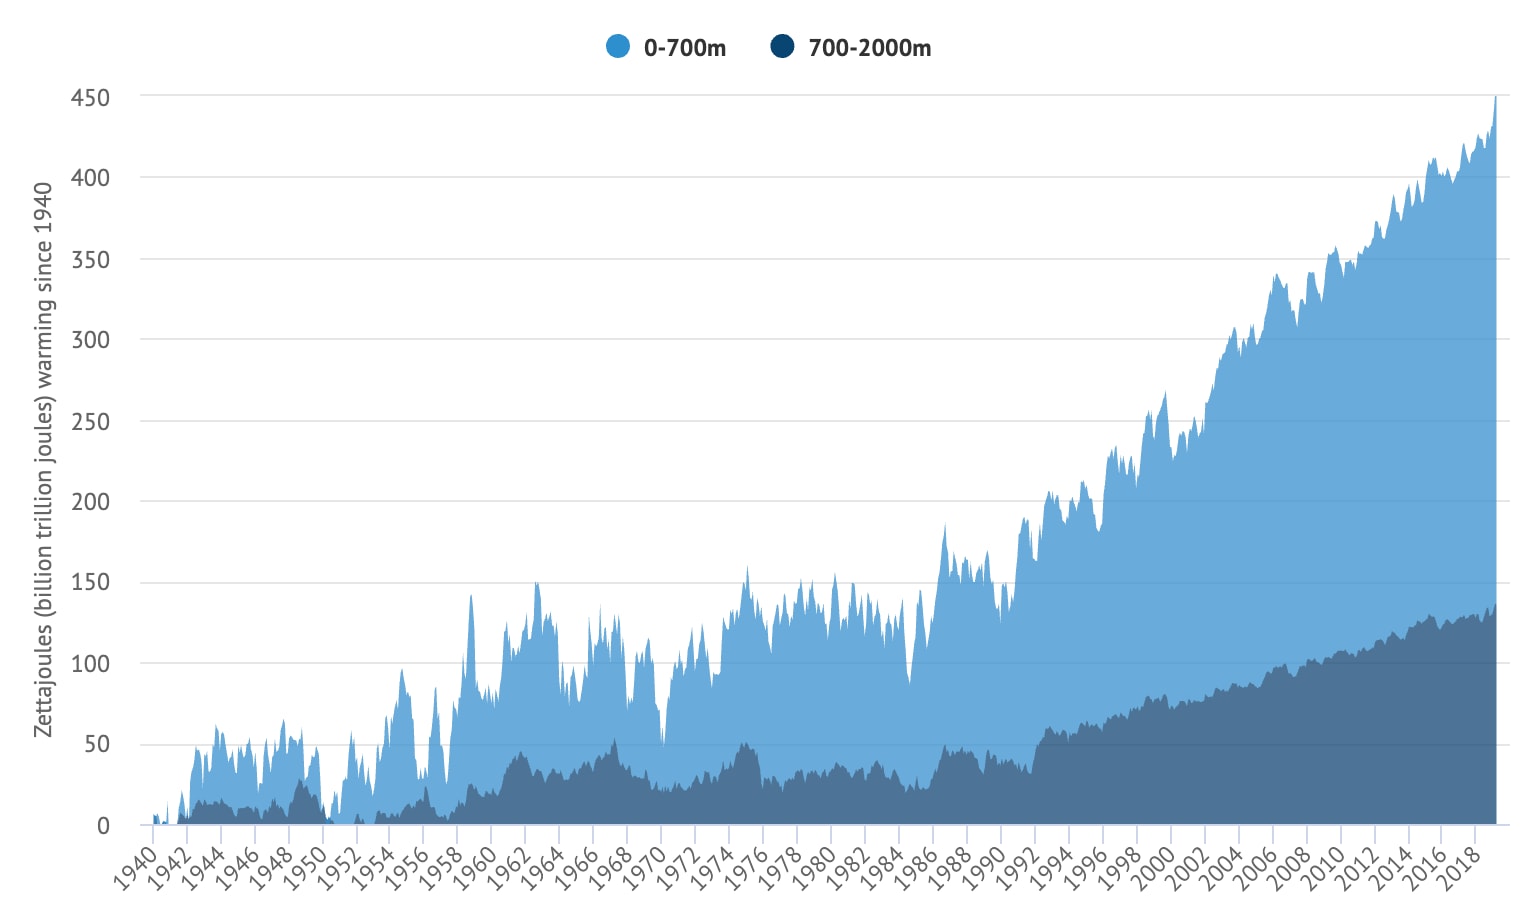
- Increased ocean temperatures. 5-7x more heat uptake by 2100 (than the accumulated heat uptake from 1970-2019, in top 2000 m of ocean, under RCP 8.5).
- Increased ocean stratification
- Increased acidification
- Continued oxygen decline
More frequent and severe marine heatwaves. 50x and 20x frequency increase (by 2081-2100, relative to 1850-1900, under RCP 8.5 and 2.6 respectively).
“Marine heatwaves will further increase in frequency, duration, spatial extent and intensity under future global warming (very high confidence) pushing some marine organisms, fisheries and ecosystems beyond the limits of their resilience, with cascading impacts on economies and societies (high confidence). Globally, the frequency of marine heatwaves is very likely to increase by a factor of 46- 55 by 2081-2100 under the RCP8.5 scenario and by a factor of 16-24 under the RCP2.6 scenario, relative to the 1850-1900 reference period. These future trends in MHW frequency can largely be explained by increases in mean ocean temperature. The largest changes in the frequency of marine heatwaves are projected for the Arctic Ocean and the tropical ocean (medium confidence).” 35
“Limiting global warming would reduce the risk of impacts of marine heatwaves, but critical thresholds for some ecosystems (e.g. kelp forests, coral reefs) will be reached at relatively low levels of future global warming (high confidence).” 36
Ecosystem risks
- Decrease in global biomass under all emissions scenarios. Global-scale biomass -15% (±5.9%) and maximum catch potential -20.5–24.1% (by 2100, under RCP8.5). 37
- Decline in net primary productivity by 4-11% (by 2081-2100, relative to 2006-2015, under RCP8.5). 38
- Highest impacts in the tropics.
- Polar net primary production will continue to increase with additional warming and sea ice loss. 39
- Loss of species habitat and diversity. Capacity of ecosystems to adapt is higher at lower emissions scenarios. Increased impacts in higher emission scenarios. 40
Coral reefs
Ocean warming, oxygen loss, acidification and a decrease in flux of organic carbon from the surface to the deep ocean are projected to harm habitat-forming cold-water corals, which support high biodiversity, partly through decreased calcification, increased dissolution of skeletons, and bioerosion (medium confidence). 41
Almost all coral reefs will degrade from their current state, even if global warming remains below 2°C (very high confidence), and the remaining shallow coral reef communities will differ in species composition and diversity from present reefs (very high confidence). These declines in coral reef health will greatly diminish the services they provide to society, such as food provision (high confidence), coastal protection (high confidence) and tourism (medium confidence) 42
Almost all warm-water coral reefs are projected to suffer significant losses of area and local extinctions, even if global warming is limited to 1.5°C (high confidence). 43
- The Ocean and Cryosphere in a Changing Climate. Geneva, Switzerland: IPCC. 25 Sep 2019. P 13.↩︎
- The Ocean and Cryosphere in a Changing Climate. Geneva, Switzerland: IPCC. 25 Sep 2019. P 13.↩︎
- The Ocean and Cryosphere in a Changing Climate. Geneva, Switzerland: IPCC. 25 Sep 2019. P 13.↩︎
- The Ocean and Cryosphere in a Changing Climate. Geneva, Switzerland: IPCC. 25 Sep 2019. P 10.↩︎
- The Ocean and Cryosphere in a Changing Climate. Geneva, Switzerland: IPCC. 25 Sep 2019. P 13.↩︎
- Energy Flow & Primary Productivity. Khan Academy. Retrieved 16 Nov 2019.↩︎
- The Ocean and Cryosphere in a Changing Climate. Geneva, Switzerland: IPCC. 25 Sep 2019. P 13.↩︎
- In-Depth Q&A: The IPCC’s Special Report on the Ocean and Cryosphere. Carbon Brief. 25 Sep 2019. Retrieved 15 Nov 2019.↩︎
- The Ocean and Cryosphere in a Changing Climate. Geneva, Switzerland: IPCC. 25 Sep 2019. P 8.↩︎
- The Ocean and Cryosphere in a Changing Climate. Geneva, Switzerland: IPCC. 25 Sep 2019. P 8.↩︎
- The Ocean and Cryosphere in a Changing Climate. Geneva, Switzerland: IPCC. 25 Sep 2019. P 9.↩︎
- The Ocean and Cryosphere in a Changing Climate. Geneva, Switzerland: IPCC. 25 Sep 2019. PP 6–3.↩︎
- In-Depth Q&A: The IPCC’s Special Report on the Ocean and Cryosphere. Carbon Brief. 25 Sep 2019. Retrieved 15 Nov 2019.↩︎
- The Blob (Pacific Ocean). Wikipedia. 25 Oct 2019. Retrieved 16 Nov 2019.↩︎
- Ocean “blob” Brings Bad Fish Food to B.C. Waters. CBC. 8 Jun 2015. Retrieved 16 Nov 2019.↩︎
- Ocean Acidification. Wikipedia. 13 Nov 2019. Retrieved 16 Nov 2019.↩︎
- Preliminary Strategic Climate Risk Assessment for British Columbia. Victoria, BC: Government of British Columbia. 2019. P 55.↩︎
- The Ocean and Cryosphere in a Changing Climate. Geneva, Switzerland: IPCC. 25 Sep 2019. P 9.↩︎
- The Global Climate in 2015–2019. World Meteorological Organization. 22 Sep 2019. P 7.↩︎
- Ocean Acidification. Wikipedia. 13 Nov 2019. Retrieved 16 Nov 2019.↩︎
- Preliminary Strategic Climate Risk Assessment for British Columbia. Victoria, BC: Government of British Columbia. 2019. P 55.↩︎
- Guest Post: How Global Warming Is Causing Ocean Oxygen Levels to Fall. Carbon Brief. 15 Jun 2018. Retrieved 16 Nov 2019.↩︎
- The Ocean and Cryosphere in a Changing Climate. Geneva, Switzerland: IPCC. 25 Sep 2019. P 10.↩︎
- Guest Post: How Global Warming Is Causing Ocean Oxygen Levels to Fall. Carbon Brief. 15 Jun 2018. Retrieved 16 Nov 2019.↩︎
- The Ocean and Cryosphere in a Changing Climate. Geneva, Switzerland: IPCC. 25 Sep 2019. P 10.↩︎
- What Causes Algal Blooms, and How We Can Stop Them?. Phys Org. 10 Jan 2019. Retrieved 16 Nov 2019.↩︎
- What Is a Harmful Algal Bloom?. National Oceanic and Atmospheric Administration. 27 Apr 2016. Retrieved 16 Nov 2019.↩︎
- The Ocean and Cryosphere in a Changing Climate. Geneva, Switzerland: IPCC. 25 Sep 2019. P 18.↩︎
- Reference Term: Algal Bloom. ScienceDaily. Retrieved 16 Nov 2019.↩︎
- Algal Bloom. Wikipedia. 13 Nov 2019. Retrieved 16 Nov 2019.↩︎
- What Causes Algal Blooms, and How We Can Stop Them?. Phys Org. 10 Jan 2019. Retrieved 16 Nov 2019.↩︎
- Dead Whales in Pacific Could Be Fault of the Blob. CBC News. 15 Sep 2015. Retrieved 16 Nov 2019.↩︎
- What Is a Harmful Algal Bloom?. National Oceanic and Atmospheric Administration. 27 Apr 2016. Retrieved 16 Nov 2019.↩︎
- The Ocean and Cryosphere in a Changing Climate. Geneva, Switzerland: IPCC. 25 Sep 2019. P 19.↩︎
- The Ocean and Cryosphere in a Changing Climate. Geneva, Switzerland: IPCC. 25 Sep 2019. PP 6–4.↩︎
- The Ocean and Cryosphere in a Changing Climate. Geneva, Switzerland: IPCC. 25 Sep 2019. PP 6–4.↩︎
- The Ocean and Cryosphere in a Changing Climate. Geneva, Switzerland: IPCC. 25 Sep 2019. P 25.↩︎
- The Ocean and Cryosphere in a Changing Climate. Geneva, Switzerland: IPCC. 25 Sep 2019. PP 5–7.↩︎
- The Ocean and Cryosphere in a Changing Climate. Geneva, Switzerland: IPCC. 25 Sep 2019. P 25.↩︎
- The Ocean and Cryosphere in a Changing Climate. Geneva, Switzerland: IPCC. 25 Sep 2019. P 29.↩︎
- The Ocean and Cryosphere in a Changing Climate. Geneva, Switzerland: IPCC. 25 Sep 2019. P 26.↩︎
- The Ocean and Cryosphere in a Changing Climate. Geneva, Switzerland: IPCC. 25 Sep 2019. PP 5–8.↩︎
- The Ocean and Cryosphere in a Changing Climate. Geneva, Switzerland: IPCC. 25 Sep 2019. P 29.↩︎
